

Nobody enjoys being asked “how’s it going?” — and as the one leading a project at work, I still need to know how it’s going. My compromise is the git graph: I look at it before I ask anyone anything, and most of the time it already has the answer. It shows commit activity, branching and merging at a glance, and nobody has to sit in a meeting for it.
What the graph actually tells you#
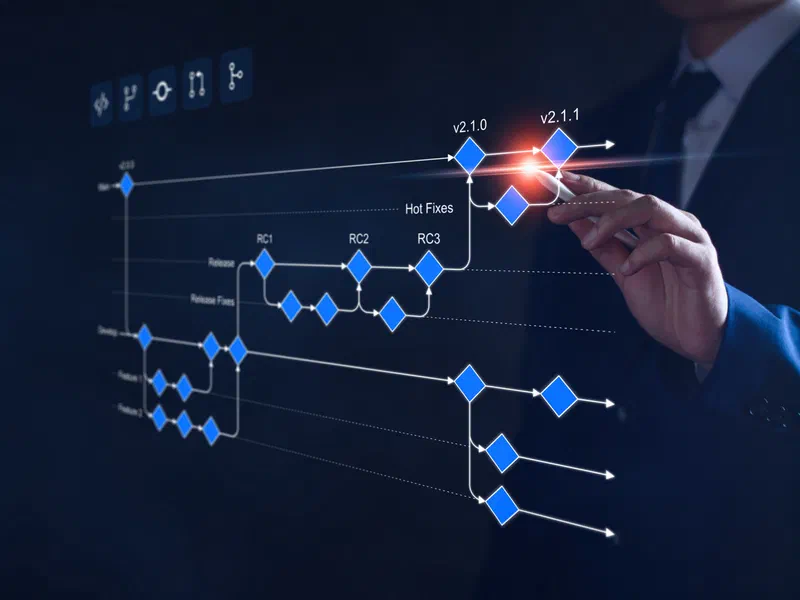
If you haven’t looked at one closely: every node is a commit, every divergent path is a branch, and the whole thing reads as a timeline of the project. That layout carries a surprising amount of information:
- A glance shows how many branches are active and how often commits are landing.
- A branch that suddenly goes quiet, or one that hasn’t merged for weeks, usually means someone is stuck. That’s an early warning worth having.
- Merge frequency tells you how the team collaborates. Frequent merges mean work is actually being integrated; long-lived branches usually mean someone has drifted off into siloed work.
Fewer interruptions, better conversations#
The obvious win is that I don’t have to interrupt anyone to know where things stand. The bigger win is what happens when a conversation is needed: it starts from the graph rather than from assumptions. “This branch hasn’t moved since Tuesday — anything blocking you?” is a much better opener than “any updates?”
It also helps to make the routine explicit. Mine is a quick glance most mornings and a proper look once a week. The team knows that’s the rhythm, so nobody gets surprised.
Don’t turn it into surveillance#
This is the part I have to keep reminding myself of. Commit count is not value — one thoughtful commit can beat fifty noisy ones. Seeing every commit doesn’t entitle you to question every decision; trust the team and step in only when a pattern genuinely looks like trouble. And when you do bring the graph into a conversation, it’s a starting point for feedback, not evidence for a prosecution.
Tools for viewing the graph#
There are plenty of options, most of them free:
git log --graph --all --oneline— a text-based graph right in the terminal, nothing to install.- Gitk — Git’s built-in GUI for browsing history.
- SourceTree — free GUI from Atlassian, the Bitbucket folks.
- GitKraken — the prettiest of the bunch, with an intuitive graph view.
- TortoiseGit — context-menu integration and a history graph for Windows users.
- GitHub, GitLab and Bitbucket — all have a “network” or “graph” view built into their repo pages.
- The Git Graph extension for VS Code — an interactive graph without leaving the editor.
- Tower — another solid Git client with a visual graph.
Whichever you pick, the goal is the same: understand the progress, don’t count the commits.