
In today’s fast-paced and agile development environment, effective project management techniques are essential. Team leaders, managers, and stakeholders require a bird’s eye view of the progress of multiple projects. They need to be able to monitor progress and identify bottlenecks without overstepping and micromanaging their teams. One tool that has proven immensely useful in this regard is the Git Graph.
What is a Git Graph?#
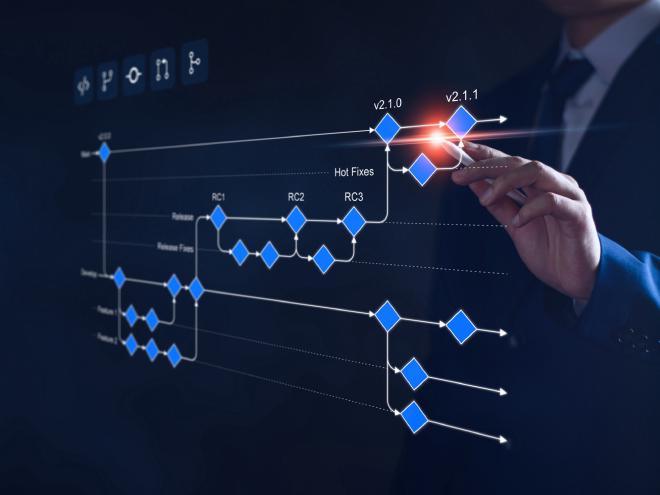
For those unacquainted, a Git Graph is a visual representation of the commit history in a Git repository. It displays the various branches, commits, and the relationships between them, offering a chronological view of the development process. Every node in the graph represents a commit, and the branches are depicted as divergent paths.
How Can Git Graphs Improve Project Visibility?#
Holistic View of Progress: Git Graphs give stakeholders a complete view of the repository’s history. By simply glancing at the graph, one can quickly gauge the number of active branches, the frequency of commits, and the overall development activity.
Identify Roadblocks: A sudden halt in commits or a branch that hasn’t merged for an unusually long time might indicate a challenge or roadblock. These patterns can act as early warning signals for project managers.
Review Merges and Collaboration: Seeing how often branches merge can provide insights into the team’s collaboration patterns. Regular merging indicates that features or fixes are being integrated frequently, while long-standing branches might suggest isolated or siloed work.
Reducing Interruptions with Git Graphs:#
Autonomous Monitoring: Instead of constantly checking in with team members or arranging frequent update meetings, managers can refer to the Git Graph. This reduces interruptions and allows team members to focus on their tasks.
Data-Driven Conversations: When discussions are necessary, having a Git Graph as a reference ensures that the conversation is grounded in data and facts, rather than assumptions.
Setting Expectations: By establishing a routine around Git Graph reviews (say, a quick glance every morning or a deeper dive once a week), teams know what’s expected and can prepare accordingly.
Avoiding the Pitfalls of Micromanagement:#
While Git Graphs are powerful, they should not become a tool for micromanagement. It’s essential to remember:
Commits Don’t Equate to Value: A large number of commits doesn’t necessarily mean more value was delivered. It’s the quality and impact of those commits that matter.
Respect Autonomy: Just because you can see every commit doesn’t mean you should question every decision. Trust your team and only intervene when patterns indicate potential issues.
Feedback, Not Criticism: Use the data from Git Graphs as a starting point for constructive feedback, not as a tool for critical evaluation.
Here are some popular tools that provide such Git visualizations:
Git’s Built-in Log Command: Using
git log --graph --all --oneline, you can view a text-based graph of your repository right in the terminal.Gitk: This is Git’s built-in GUI tool. It provides a visual representation of the commit history.
SourceTree: This is a free Git GUI tool provided by Atlassian, the makers of Bitbucket. It offers a visual graph of the repository’s history among other features.
GitKraken: This is a popular and visually appealing Git client that has a beautiful and intuitive interface for visualizing the commit history.
TortoiseGit: For Windows users, TortoiseGit offers context menu integrations and a history graph.
GitHub, GitLab, Bitbucket: These popular Git platforms offer their own visualizations of repositories. When you look at a repo on these platforms, you’ll typically see a “network” or “graph” view that shows branching and merging in a visual way.
Git Graph extension for Visual Studio Code: This extension provides an interactive graph to visualize the commit history and more, all within the VS Code environment.
Tower: Another powerful Git client that provides a visual graph of your repositories.
Conclusion:#
In the world of software development and project management, visibility and autonomy are not mutually exclusive. By leveraging tools like Git Graphs, project managers and stakeholders can have the visibility they crave without resorting to intrusive micromanagement. It’s all about striking the right balance and using the available data in a constructive and respectful manner.